GitHub dashboards v2
Published on Apr 22, 2022 by Arpad Ray
A few weeks ago I deployed a pretty significant change in how our GitHub dashboards are rendered. Instead of a single SVG image to embed, we now generate templated Markdown / reST which may include smaller SVG components.
I haven't had the time to write about it until now, but I think it's worth explaining the rationale and the implications.
I'd received a fair amount of feedback (thanks!) about the dashboards. Lots of positive feedback but among the more critical, there were a few common themes:
- They took up too much space in a README
- Didn't scale well on mobile
- Didn't work very well in dark mode
- Included information which wasn't always relevant to the repo
The main hurdle in addressing these points was that we were generating a single SVG per dashboard. During the generation of this SVG we can make some guesses about what you'd like to see, but it's fundamentally a one-size-fits-all approach.
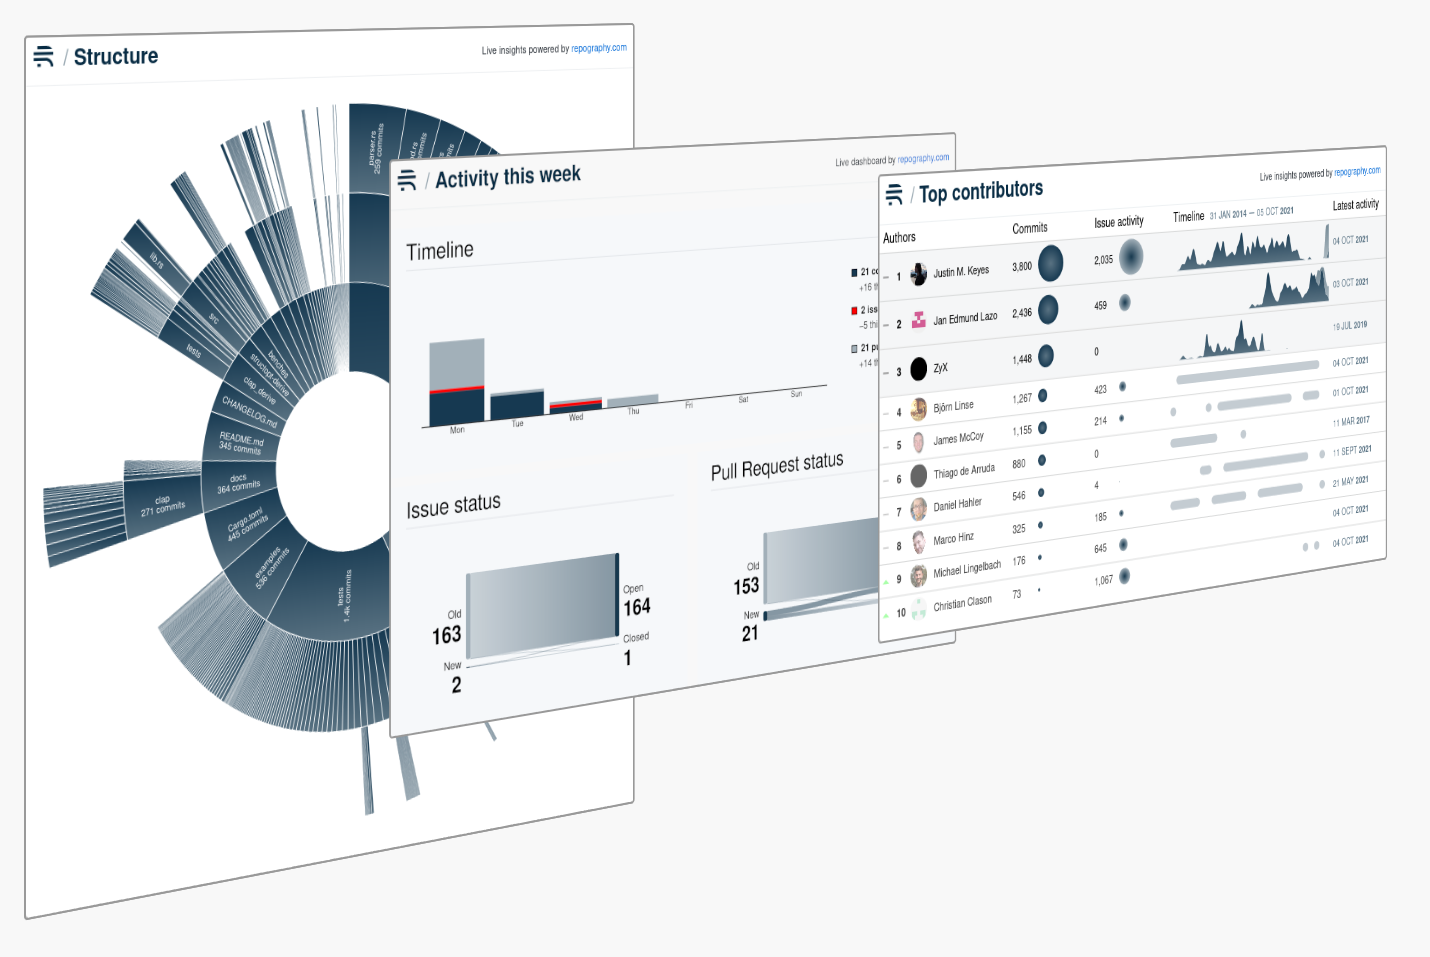
Right now the "Recent Activity" dashboard is the main beneficiary. Being composed of several components it's a great opportunity to put more power in the hands of the user. You can now select which components you'd like to have included. For example many repos don't accept issues, so that component you can ignore completely.

More generally, this change has some great benefits:
- Responsive: Smaller components can become single-column on mobile, rather than the whole image scaling down.
- Improved accessibility, and legibility in dark mode: By generating appropriate semantic markup the dashboards fit more naturally into your README regardless of the context.
- Meaningful links for individual components, e.g. the issue status diagram links to the Issues page.
I'm continuing to work on the dashboards - both improving the output of the existing designs and also developing some new ideas - so it's worth checking back regularly to see what's new.
If you've already embedded the dashboards
This change is fully backwards compatible so there's no need to do anything if you're happy with what you have now, your dashboard will continue to be updated. I think there is still merit in a single-SVG version which can be more opiniated, so that won't be going away any time soon.
More feedback, please!
Thanks to everyone who's already using our GitHub dashboards, and especially those who've taken the time to feed back on how they could be improved. It's hugely appreciated!
Whether you're tickled or irritated by something we're doing now, or you have a great idea of something else we could be doing, I'd love it hear it. Please send me an email directly at [email protected].
What is Repography?
Repography is a web app which creates data visualizations for your Git repos. You can use our command line script to try out Repography on any Git repo, or install our GitHub app.
![[object Object]](/images/posters.png)
Our posters are available for purchase both as downloads ($5) and as framed prints (from $109).
You can now buy Repography gift cards!
One click, no signup required