AboutGift cardsBlogLaunch app

How to embed a live dashboard in your GitHub README.md

Published on Feb 6, 2022 by Arpad Ray

The README.md is a crucial document to invest effort in. It's both the first impression for newcomers to your project, and is also seen regularly by your team members and users it serves as both a billboard and a noticeboard.

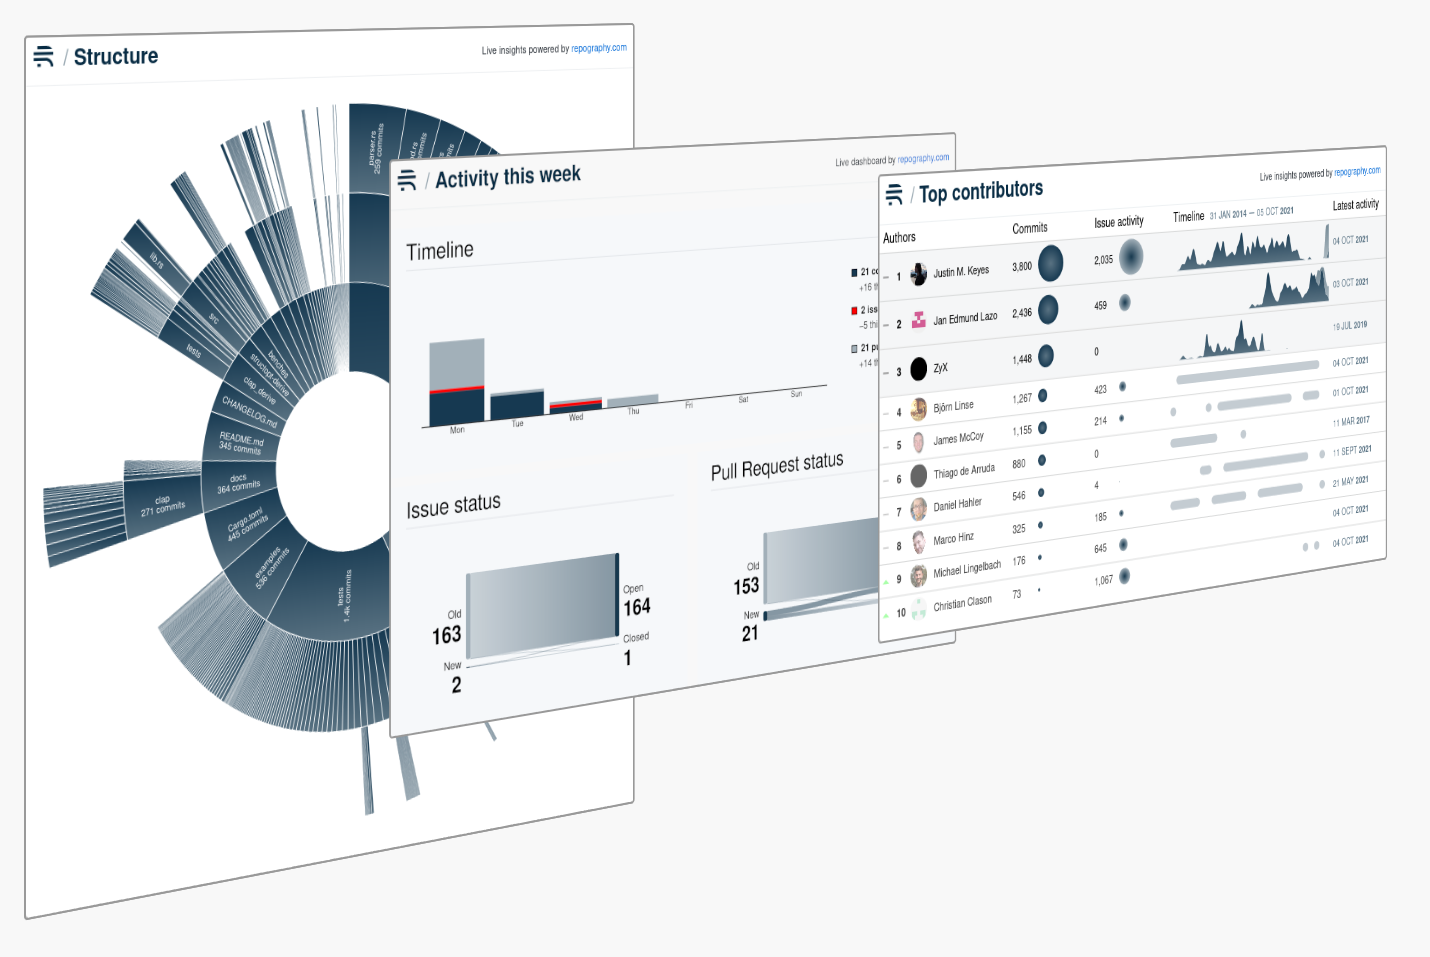
The Repography dashboards have been designed to instantly enrich your README.md and are kept up-to-date automatically.

In this post I'll walk through the process of embedding a dashboard from start to finish.

One of the Repography dashboards: An overview of your repo's top contributors both by commit and issue activity
0

Sign in to GitHub

First of all on the Repography site click on the "Login with GitHub" button which is in the "GitHub" tab.
1

Authorize Repography to identify you

Now GitHub asks to you to let Repography access your GitHub account. This lets us identify you and see which organizations you belong to (you'll be able to see their Repography installations too, for repos you've been given access to).
2

Add an installation

Now we're back on Repography, and can identify your GitHub account. If you haven't yet installed the GitHub app you can click on the "Install on GitHub" button to begin the process.
3

Choose a plan on GitHub

Here's where we get to the actual GitHub app. The Basic plan is free and will let you create dashboards for unlimited public repositories and one private repository.
4

Complete the order

Even free GitHub apps are considered a subscription so there's an extra confirmation step.
5

Customize the installation

Here's where you can see the permissions that Repography actually needs. We need write access to create webhooks, keeping your dashboard up to date, but otherwise just read-only access to the data we visualize.
6

Add a repo

Back on Repography again, we now have an installation. To add your first repo click on the "Add repo" button.
7

Choose the repo to add

If you don't see the repo in the list that you're looking for, it's possible you selected individual repos to provide access to, and didn't include this one. You can change that by clicking on the button to configure your plan.
8

Enable the webhook

It's important to enable the webhook to keep your dashboard up-to-date automatically. If you were only interested in the posters you could leave this disabled.
9

Select your repo

After a short wait (usually a few seconds) you can click on the name of your repo to select it.
10

Select the dashboard

Now you can choose which dashboard you'd like to embed.
11

Copy the embed code

Finally click on the "Copy code" button to get the Markdown code which you can paste into your README.md to embed your dashboard.

What is Repography?

Repography is a web app which creates data visualizations for your Git repos. You can use our command line script to try out Repography on any Git repo, or install our GitHub app.

Our dashboards are kept up-to-date automatically and are designed to be embedded in your README.md.
[object Object]

Our posters are available for purchase both as downloads ($5) and as framed prints (from $109).

You can now buy Repography gift cards!

One click, no signup required

BETA