Some more interesting aspects to SVG images
Published on June 1, 2022 by Arpad Ray
The other day I came across an interesting article on Hacker News: Magical SVG Techniques. It's a nice collection of interesting things people have done with Scalable Vector Graphics (SVG), and there were some good comments.
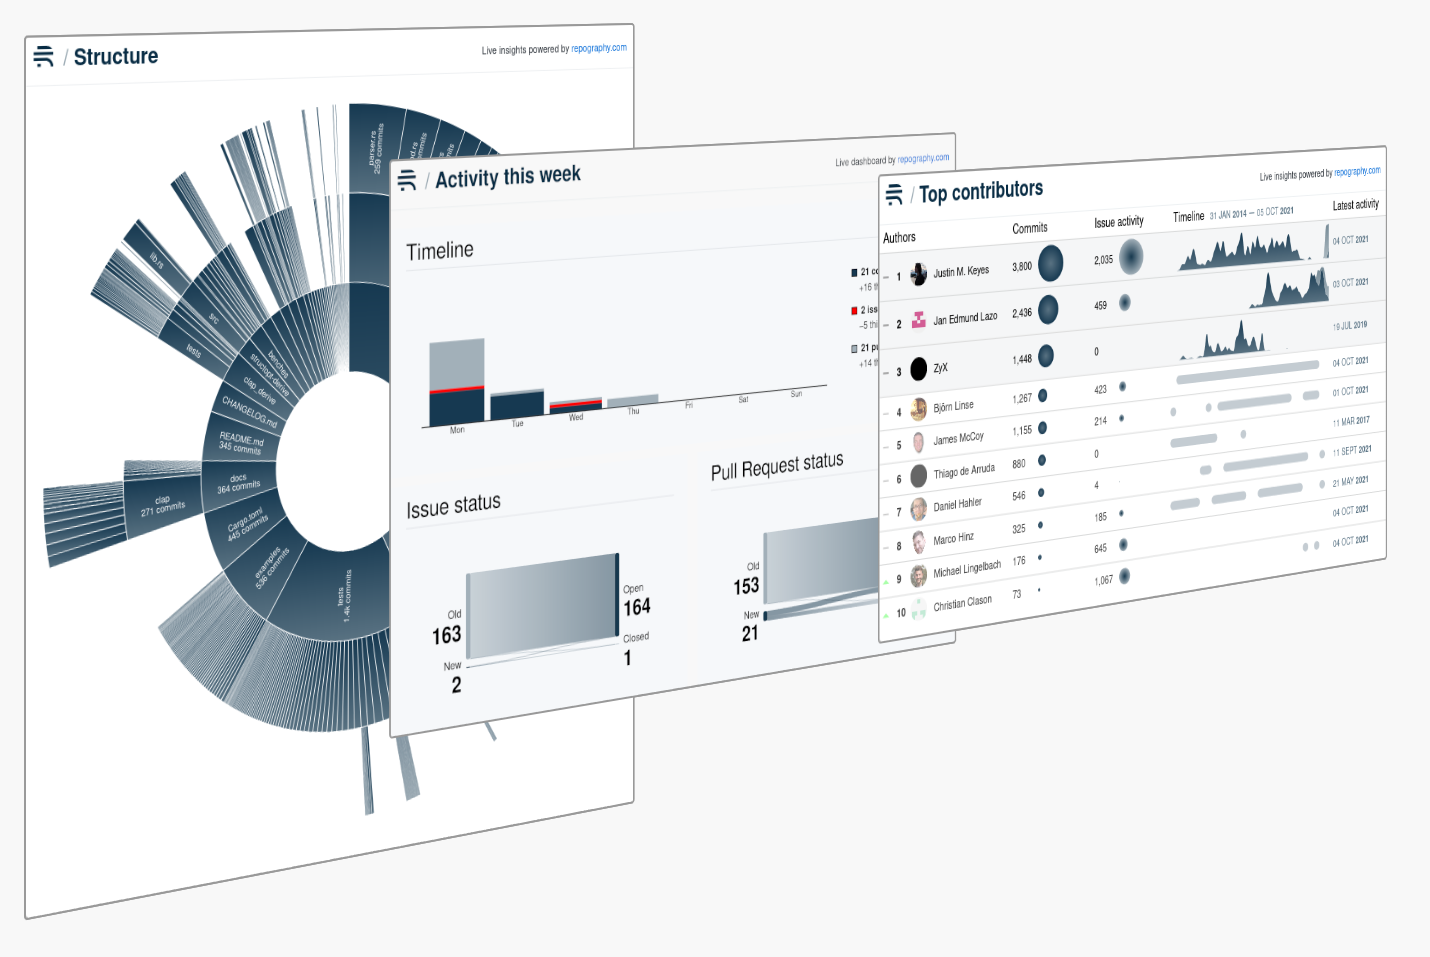
Both the dashboards and the posters on Repography are generated with SVG so I've spent a lot of time recently neck deep in the details of the format, and dealing with the reality of how it's implemented in the wild. Here are a few things I've found surprising:
#1 Rendering differences
Back in 1998 when the original Acid test for browsers was conceived, web development was a minefield of inconsistency. Nowadays web browsers are less diverse and they're hugely more respectful of standards. Modern web frameworks and tools help enormously to paper over the differences, and most of the time we're not having to make too much active effort to cater for different platforms.
All of that goes out the window when we use SVG. Our fancy tools are no help now. Yes there are fewer dominant browser engines and they're doing a largely better job at compatibility, but you're just going to have to try and see if your thing works on each platform. Sometimes banal details are rendered significantly differently.

There are now efforts - like the Acid test - to test the important points of the specification and measure overall conformance, but these are oriented towards the implementors not the users. Can I Use is still helpful at a feature level, but it's impractical to go into much detail.
One more subtle difference - which I only found when rasterising SVG images for print - is dithering. Without it, a gradual gradient can result in pronounced lines which give a "banding" effect. I tried every rasterising library I could find, but eventually settled with Chromium, which I believe uses Skia for the SVG rendering itself. Every time someone buys a Repography poster, a Docker instance is briefly spun up, which launches Chromium and takes a print-resolution screenshot of the design.

#2 Embed all the things
For our dashboards, the SVG is consumed as an image rather than embedded in the DOM. In this context immediately lots of things aren't allowed, like scripting and fetching remote resources.
The thing which I found surprising here is that remote resources can be embedded as data URLs and there's no perceivable disadvantage. There's some inefficiency (33%) in encoding resources in base 64 to make data URLs but a lot of this is mitigated in compression, and arguably it's better not to have to make other requests after parsing the SVG.
We can even embed fonts like this, although it's much more common to do the opposite and encode individual characters as paths.
#3 Kind-of responsive SVGs
SVG in theory supports CSS media queries which is a really cool concept, but this is also something deliberately restricted when the SVG is referenced in an HTML img (to avoid device fingerprinting). I started looking into this with the hope of providing a condensed view of some dashboards for mobile viewers, but the queries left unrestricted aren't too helpful.
Firefox does permit querying some device characteristics but both Chrome and Safari report default values as an img, except viewport orientation and user preferences like a dark colour scheme.
Here's a little test to see what your browser is reporting (you can also load the SVG directly to see what happens outside of the img context):
![[object Object]](https://assets.repography.com/file/repography-assets/blog/svgs/responsive.svg)
I'm still a big fan of SVG. It's an amazingly powerful language to express vector designs, and with the support for raster images, filters and 3D transformations it feels like there's really not much you can't do with it.
The other key aspect - which has made Repography possible - is that SVGs can easily be generated programmatically. The SVG Document Object Model (DOM) is already a nice high-level interface to what you see on screen, and libraries like D3.js help a lot with the more inscrutable bits like the path syntax.
What is Repography?
Repography is a web app which creates data visualizations for your Git repos. You can use our command line script to try out Repography on any Git repo, or install our GitHub app.
![[object Object]](/images/posters.png)
Our posters are available for purchase both as downloads ($5) and as framed prints (from $109).
You can now buy Repography gift cards!
One click, no signup required